We sell a B2B subscription to a platform for hosting large-scale remote meetings, conferences, and webinars. The product supports up to 200 speakers and 10,000 concurrent attendees, which puts us squarely in the enterprise and institutional segment.
Our core buyers are universities, government organizations, and mid-to-large enterprises (100+ employees), representing a total addressable market of roughly 30,000 accounts.
At this scale, manual outbound is inefficient, but the market is still too narrow for broad, interest-based ad targeting. Combined with a long sales cycle and multiple pre-purchase touchpoints, this made it difficult to clearly attribute conversions to individual channels — and even harder to decide where incremental budget would actually drive pipeline.
Nurturing works — now we need to acquire new accounts
As mentioned, our target market consists of roughly 30,000 accounts, and we had already reached approximately 12,000 of them through outbound and inbound efforts. We had already optimized for converting in-market demand and maximizing value from existing accounts. The next challenge was generating incremental demand from net-new accounts that closely matched our ideal customer profile.Success was measured in signed contracts and revenue, not lead volume or MQLs.
The core challenge was reaching decision-makers — company directors and department heads — with nothing more than limited firmographic data, typically a name and, in some cases, a work email. This is a common constraint for B2B companies operating in narrow, account-based markets.
On top of that, we face four specific challenges:
1/ Multiple decision-makers across organizations. The person responsible for choosing a video meeting platform varies by industry. In educational institutions, it might be deans or deputy heads; in corporations — HR or department heads; in government entities — local managers. Altogether, we identified more than 20 distinct roles, which is far too many for standard job-title-based targeting to scale efficiently.
2/ Social networks work but aren’t scalable long-term. Instagram and Facebook ads perform well initially, but targeting quickly saturates.
3/ Attribution windows are shorter than our sales cycle. On average, it takes 4–12 months from first interaction to a paid subscription. Ad platforms’ attribution windows are much shorter — 7 days for Facebook, 90 days for Google — making it difficult to optimize campaigns effectively.
4/ 100+ touchpoints from 10+ employees per account. Typically, more than 10 people from the same organization register on our platform, but only 3–4 are actual stakeholders. For example, in a corporate university, the director makes the final decision, with input from IT managers and approval from the information security department. Teachers may register to test features — clicking key buttons, viewing pricing, or requesting demos — but they aren’t buyers. This creates noise for ad pixels and reduces optimization accuracy across platforms.
We couldn’t scale campaigns — ROAS was barely breaking even
We were acquiring leads from social media — primarily Facebook and Instagram — using standard demographic- and interest-based targeting. We identified roughly 50–70 interests that describe our audience well, such as “corporate training” and “distance learning.” However, the audience segment is small and quickly saturates. Expanding it by adding broader interests doesn’t increase relevant reach — it only reduces quality. For example, broadening the category to “education” pulls in students.
We also tried building lookalike audiences (LAL) based on qualified leads and existing clients. Even here, results were inconsistent. In B2B, 50–100 sales per quarter is typical. Sending final conversions back to ad platforms provides too little data for stable optimization. Segmentation by specific attributes can help capture relevant users, but the large share of non-target traffic drives up acquisition costs.
As a result, lead quality from Facebook was low, and ROAS hovered near breakeven. For our economics to make sense, we need ROAS > 3 — but we were stuck at ROAS = 2. At that level, scaling campaigns was simply impossible.
We also tried manually building custom audiences. Targeting them on social media requires either an email or phone number linked to a user account, so we collected decision-makers’ personal contacts from offline events. Those campaigns delivered good ROAS, but the approach doesn’t scale — it’s impossible to gather these audiences at meaningful volume.
To achieve our growth goals, we needed not just good ROAS, but stable ROAS at scale. It was clear that new, sustainable acquisition strategies were required.
We decided to test Tomi.ai
In B2B marketing, targeting usually relies on firmographic and technographic data. Discovering that user intent could be inferred from on-site behavior — and used to optimize campaigns — was a breakthrough for us.
Our target clients exhibit consistent behavioral patterns on the website. Each user leaves behind hundreds of signals — from classic metrics like session duration, page depth, and clicks, to micro-movements across specific blocks and sections of the site.
By assigning a monetary value to each session based on user behavior, that metric becomes a powerful signal for campaign optimization, enabling segmentation of users by potential value. However, no human team can process hundreds of thousands of such signals to uncover these patterns at scale. That’s when we discovered Tomi.ai — a machine-learning solution built specifically to do exactly that.
| There are two schools of thought in digital marketing.
One approach is to manually — or with AI assistance — build as many micro-segments by interest as possible, telling ad platforms exactly whom to target. The other is to assign a value to each customer and let the platforms identify similar users on their own. Meta and Google know far more about their users than any third-party DMP, and their machine learning systems are far more powerful than any external solution. The key is feeding those systems with enough high-quality data. This is exactly how modern e-commerce operates. No one manually builds interest-based audiences anymore — they simply pass purchase data to the platforms and run Target ROAS or Minimum ROAS campaigns. |
Tomi.ai captures roughly 50× more behavioral factors than Google Analytics. For example, while Google Analytics treats form submissions as binary events — “submitted” or “not submitted” — the Tomi.ai pixel also tracks progress through the form. The platform then trains ML models to identify potentially conversion-prone users and feeds that signal back to ad platforms for optimization. For us, the most valuable users are those who register on the platform, view pricing, read help docs, and consume specific articles.
In B2B, transactions are typically scarce — click-to-purchase conversion rates often fall below 0.01% — making it impossible to optimize on actual sales alone. Tomi.ai is designed to solve exactly this problem. It predicts the expected value and revenue potential of each website visitor, including those who haven’t registered or purchased yet. About 10% of visitors fall into the “most valuable” cohort, allowing campaigns to be optimized toward the highest-potential users.
The model-building phase takes about a week, but you first need to collect at least a month of data so there’s enough to train on. After that, you launch A/B tests to verify whether you’ve actually added measurable value. You can expect first results 12–18 weeks after starting data collection. That timeframe is driven by the need to expose Tomi.ai to the entire sales cycle so the model can learn from it. If the lead-to-revenue lag is two weeks, one month of collection is sufficient; if the cohort matures longer, the waiting period extends accordingly. During this time, we keep monitoring control and test campaigns as usual.
We decided to proceed anyway — our growth and scaling targets hadn’t moved. What tipped the scales in favor of Tomi.ai was the effectively unlimited attribution window and its focus on improving business metrics, not just producing another nice-looking dashboard.
| If you’re using Google Analytics 4 with BigQuery Streaming and have already accumulated 3–4 months of data, there’s no additional waiting period before you can start seeing results. Try this for free |
We prepared a pilot and ran A/B testing
Tomi.ai’s prediction quality depends heavily on the accuracy of CRM data and how effectively it can be joined with online behavioral signals. The Tomi.ai pixel collects on-site data autonomously. On our side, the critical task is to provide clean sales data via feeds so Tomi.ai’s algorithm can stitch these datasets together and train on them.
First, Tomi.ai trained the model using the data we provided. We installed the Tomi.ai pixel on the site; over four months, it collected behavioral data. During the same period, we accumulated initial sales data and prepared a CRM feed. This allowed the service to link user behavior with outcomes via Google Analytics Client ID, User ID, and hashed email and phone, and to train the ML model to calculate purchase probability and expected value for new users.
Once the model was trained, we launched A/B testing using two campaigns with identical creatives:
A — optimized in the standard way for CPA (event: Website Leads — “SignUp”).
B — optimized for value, Min ROAS (event: Website Purchases), based on the scored data Tomi.ai sends to Meta.
Here’s how that works:
- Tomi.ai scores every visitor on the site and, within two hours of the visit, sends the predicted monetary value to the ad platform. The platform now sees value not just for the ~0.01% of users who already became customers or leads, but for every website visitor.
- Data on the top 10% of visitors is sent to the ad platform via the Marketing API. Meta now receives hundreds of times more high-quality data and optimizes not for a binary mid-funnel event (a lead), but for the user’s predicted final value.
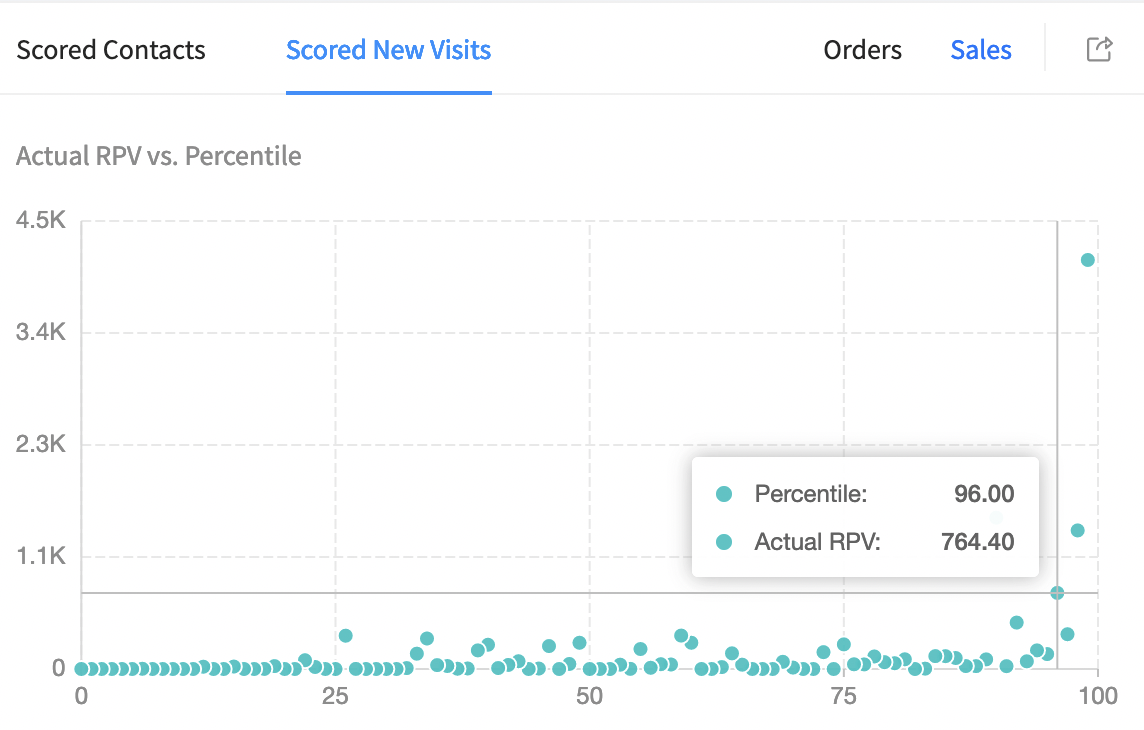
An example of the Tomi.ai dashboard: the dots represent visitors divided into percentiles. Each dot reflects the predicted visit value. You can clearly see how sharply the value declines — for the bottom 90% of visitors, it’s close to zero.
We achieved the main goal: increased ROAS
We typically calculate ROAS over 3-, 6-, and 12-month horizons. Our target ROAS is 3 on a quarterly basis and 6 over a 12-month horizon (upsells and expansions are a meaningful part of our revenue).
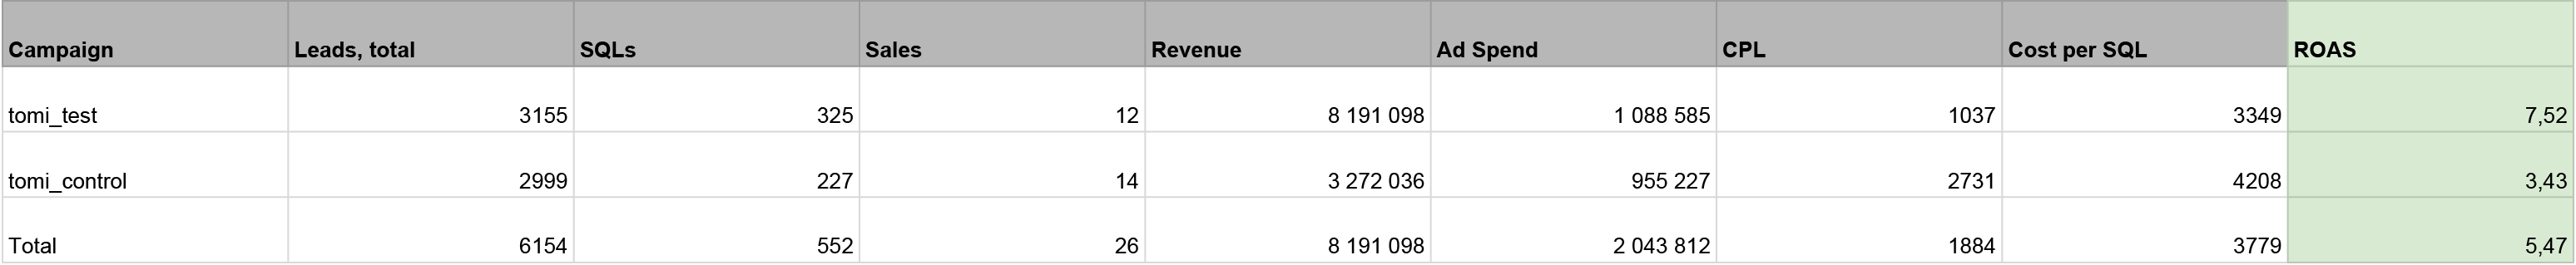
The total budget for the A/B test was $22k — $11k per campaign, including the control group. The test ran for three months. Here’s what we found:

The A/B test included two campaigns, tomi_test and tomi_control. The ROAS of the campaigns optimized with Tomi.ai’s predictive goals was 2.5 times higher.
Cohort dynamics over a one-year horizon
Development of cohorts over a one-year horizon
- The ROAS of the control campaigns over three months was 1.7, and over a one-year horizon — 3.43. This reflects our baseline performance prior to integrating Tomi.ai.
- The ROAS of the test campaigns powered by Tomi.ai after three months was 4.26. The campaigns fully paid for themselves within the test period, and the projected annual ROAS is 7.52. This exceeded our predefined targets.
After the experiment, we verified the accuracy of Tomi.ai’s value predictions against real customer revenue. We exported data on scored visits and matched contacts and found a prediction error of 16%. The forecasted revenue was approximately $1.0M, while the actual revenue recorded in our system slightly exceeded that figure.
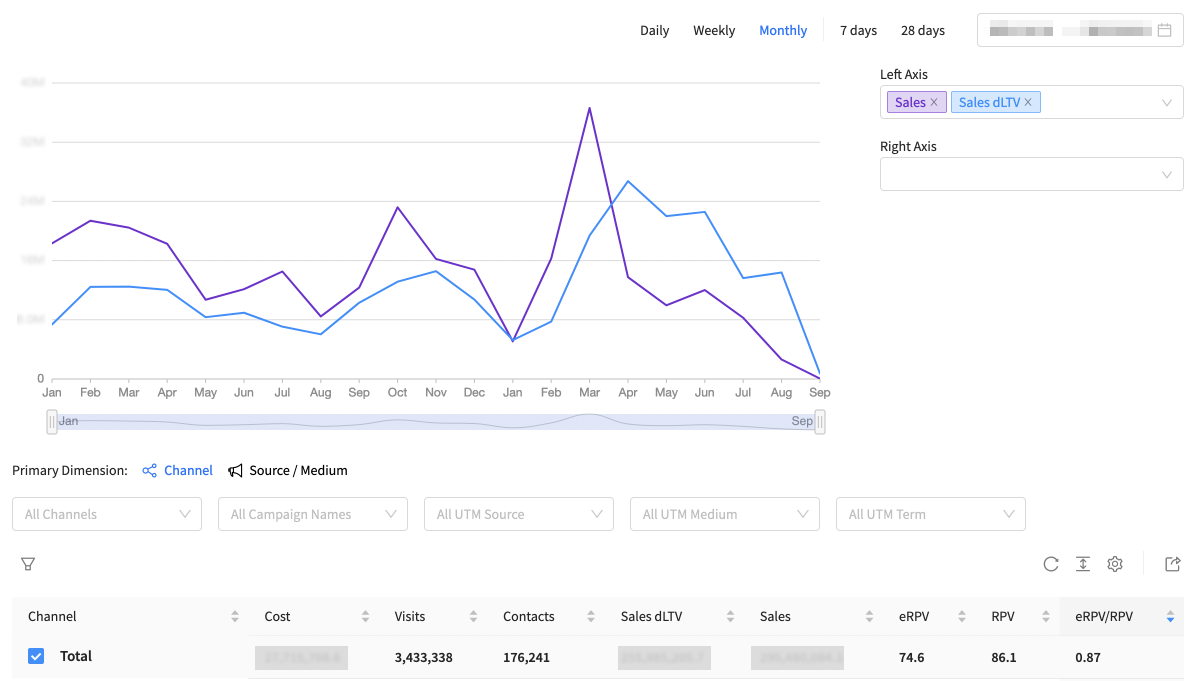
The difference between the predicted and actual revenue was only 16%. This is clearly reflected in the difference between eRPV and RPV.
How the gap between Tomi.ai’s forecast and actual sales occurs:
- A user visits the site for the first time, clicks everywhere, and closes the page. Tomi.ai assigns that session a predicted value — for example, $100.
- The same user then returns multiple times via different channels. Tomi.ai recalculates and accumulates value across visits. After, say, 20 touchpoints, the total predicted value for that user reaches $1,500.
- There are 100 such users in the segment, which means the total predicted revenue for that cohort is $150k.
- Six months later, some of these users convert — but not for $150k. The actual revenue generated by this cohort is $126k, resulting in a 16% deviation between forecast and realized revenue.
We use Tomi.ai beyond its core functionality
We formed a high-value customer core, improved the website, and cut spending on branded traffic
During the A/B test, we discovered additional ways to use the model and its scores. We learned how to analyze the customer journey (CJM) of high-value users separately from the rest of the audience — both on our website and throughout the funnel. Previously, we couldn’t track how clients interacted with our platform from first touch to repeat purchases because there wasn’t signal density. Now, thanks to Tomi.ai’s synthetic conversions, we can trace the journeys of target users (decision-makers) even if they are not yet present in our CRM.
| Tomi.ai allows us to identify and monitor a core of high-value users in our analytics stack — focusing on them rather than users who trigger on-site conversion events but have no real purchase intent. |
Here’s what we found:
- Which articles on the site drive the most engaged, high-value traffic. We gained clear insights into how to improve the blog: which topics to prioritize, which articles to make more prominent, which content attracts decision-makers and supports conversion, and which content doesn’t contribute to closing deals.
- How much budget we were wasting on branded traffic. With Tomi.ai, we analyzed predictive value data via UTM tags not only for the A/B test campaigns, but across all active acquisition campaigns driving traffic to the site. We had assumed branded traffic played a meaningful role in downstream performance. However, Tomi.ai’s eRPV (estimated Revenue Per Visit) showed the opposite: branded traffic was consuming budget without generating incremental value.
- As a result, while we previously allocated around 25% of our total ad spend to branded traffic, we have now almost completely phased it out.
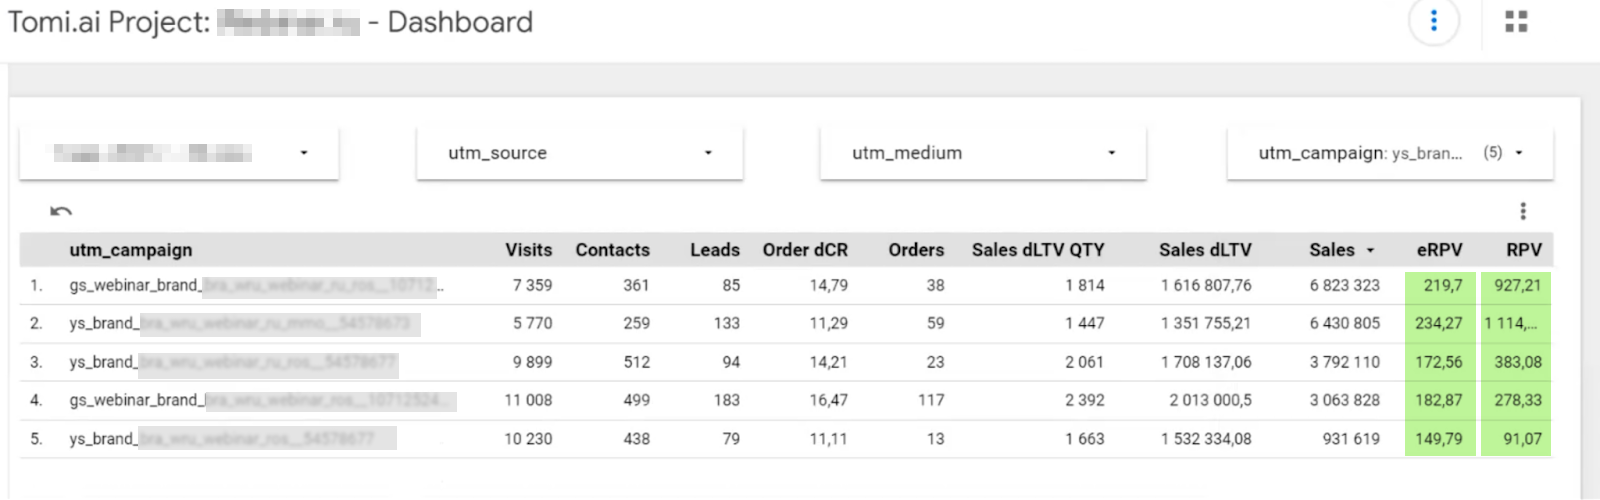
The eRPV for these campaigns (except the first one) is 1.5–6 times lower than the attributed value based on RPV. This means that the touchpoints from these campaigns are significantly overvalued.
Optimizing DSP campaigns and evaluating native integrations
Based on test results and our continued work with Tomi.ai, we’ve confirmed that predictive optimization driven by behavioral data works for our business.
Although it’s possible to manually configure campaigns that occasionally achieve ROAS comparable to Tomi.ai, that approach doesn’t scale. As soon as we increase volume, unit economics deteriorate. With Tomi.ai, we can continue growing without sacrificing efficiency.
The best part of the service is that through Tomi.ai, we can see when potential clients — even those not yet in our CRM — visit the website, and we can see the predicted monetary value of every user, including unregistered ones. From there, we can use this data to target and optimize paid advertising or analyze the effectiveness of other traffic sources.