


















Attribution that looks forward, not backward
Traditional attribution waits for the sale — which, with long sales cycles, means waiting weeks or months to learn which campaign worked. Tomi.ai calculates the probability to buy and the expected 30-90 day LTV for every website visitor and inbound lead in near real-time, so you can see the incremental value each touchpoint generates before the sale has happened.
Every touchpoint scored
See the value of each channel, campaign, and creative — paid or not — judged by the change in behavioral patterns after the interaction.
Near real-time
Forward-looking ROI per touchpoint in hours, not months. Reallocate media spend to demand-generating channels with confidence.
Demand generation vs capture
See which channels generate demand and which merely capture it — before your budget follows the wrong one.
Attribution that looks forward, not backward
Traditional attribution waits for the sale — which, with long sales cycles, means waiting weeks or months to learn which campaign worked. Tomi.ai calculates the probability to buy and the expected 30-90 day LTV for every website visitor and inbound lead in near real-time, so you can see the incremental value each touchpoint generates before the sale has happened.
Every touchpoint scored
See the value of each channel, campaign, and creative — paid or not — judged by the change in behavioral patterns after the interaction.
Near real-time
Forward-looking ROI per touchpoint in hours, not months. Reallocate media spend to demand-generating channels with confidence.
Demand generation vs capture
See which channels generate demand and which merely capture it — before your budget follows the wrong one.
Attribution that looks forward, not backward
Traditional attribution waits for the sale — which, with long sales cycles, means waiting weeks or months to learn which campaign worked. Tomi.ai calculates the probability to buy and the expected 30-90 day LTV for every website visitor and inbound lead in near real-time, so you can see the incremental value each touchpoint generates before the sale has happened.
Every touchpoint scored
See the value of each channel, campaign, and creative — paid or not — judged by the change in behavioral patterns after the interaction.
Near real-time
Forward-looking ROI per touchpoint in hours, not months. Reallocate media spend to demand-generating channels with confidence.
Demand generation vs capture
See which channels generate demand and which merely capture it — before your budget follows the wrong one.
Accurate even with a 6-week sales cycle
Predicted conversion rates track actual outcomes with high accuracy — verified when the cohorts mature.
Actual CR vs Percentile
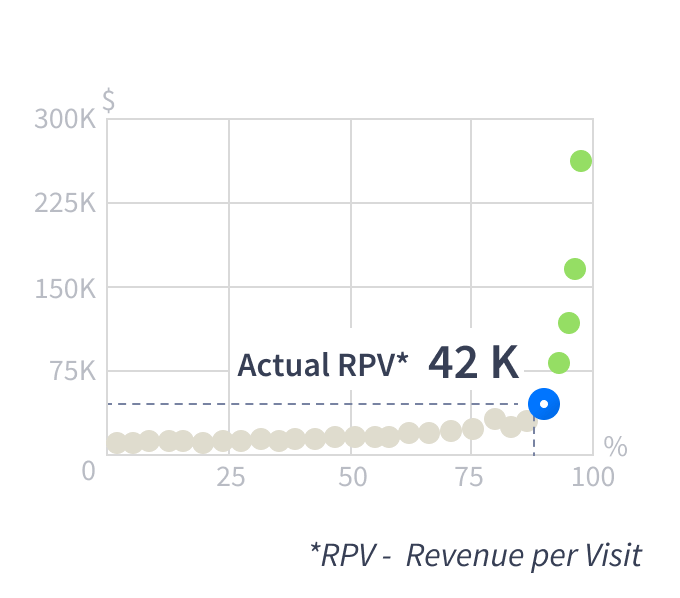
High-intent in-market buyers separate sharply from the long tail of low-intent visitors
Actual vs Predicted CR
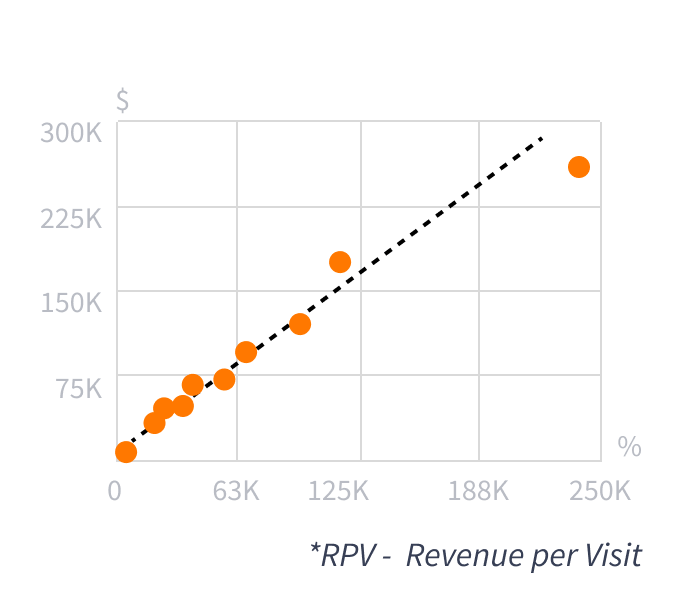
Predictions land close to actual outcomes across every percentile
Cumulative Orders vs Visits
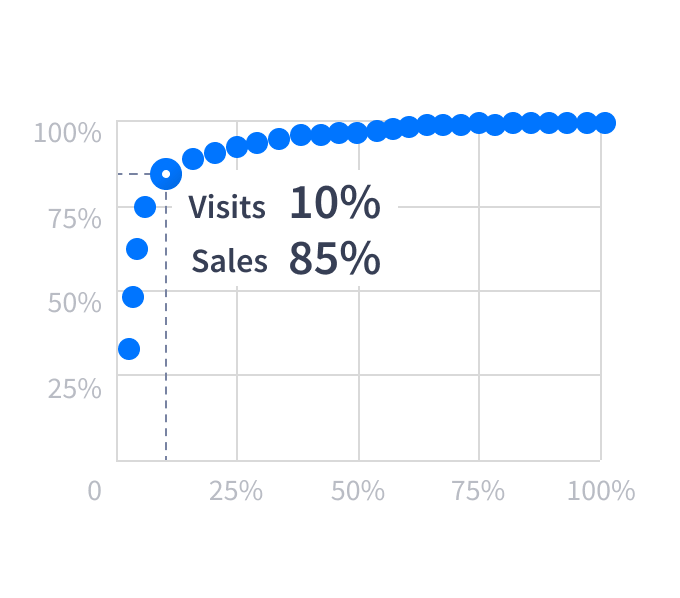
The top 10% of visits deliver 83.2% of orders — found before they convert
Accurate even with a 6-week sales cycle
Predicted conversion rates track actual outcomes with high accuracy — verified when the cohorts mature.
Actual CR vs Percentile
High-intent in-market buyers separate sharply from the long tail of low-intent visitors
Actual vs Predicted CR
Predictions land close to actual outcomes across every percentile
Cumulative Orders vs Visits
The top 10% of visits deliver 83.2% of orders — found before they convert
Accurate even with a 6-week sales cycle
Predicted conversion rates track actual outcomes with high accuracy — verified when the cohorts mature.
Actual CR vs Percentile
High-intent in-market buyers separate sharply from the long tail of low-intent visitors
Actual vs Predicted CR
Predictions land close to actual outcomes across every percentile
Cumulative Orders vs Visits
The top 10% of visits deliver 83.2% of orders — found before they convert
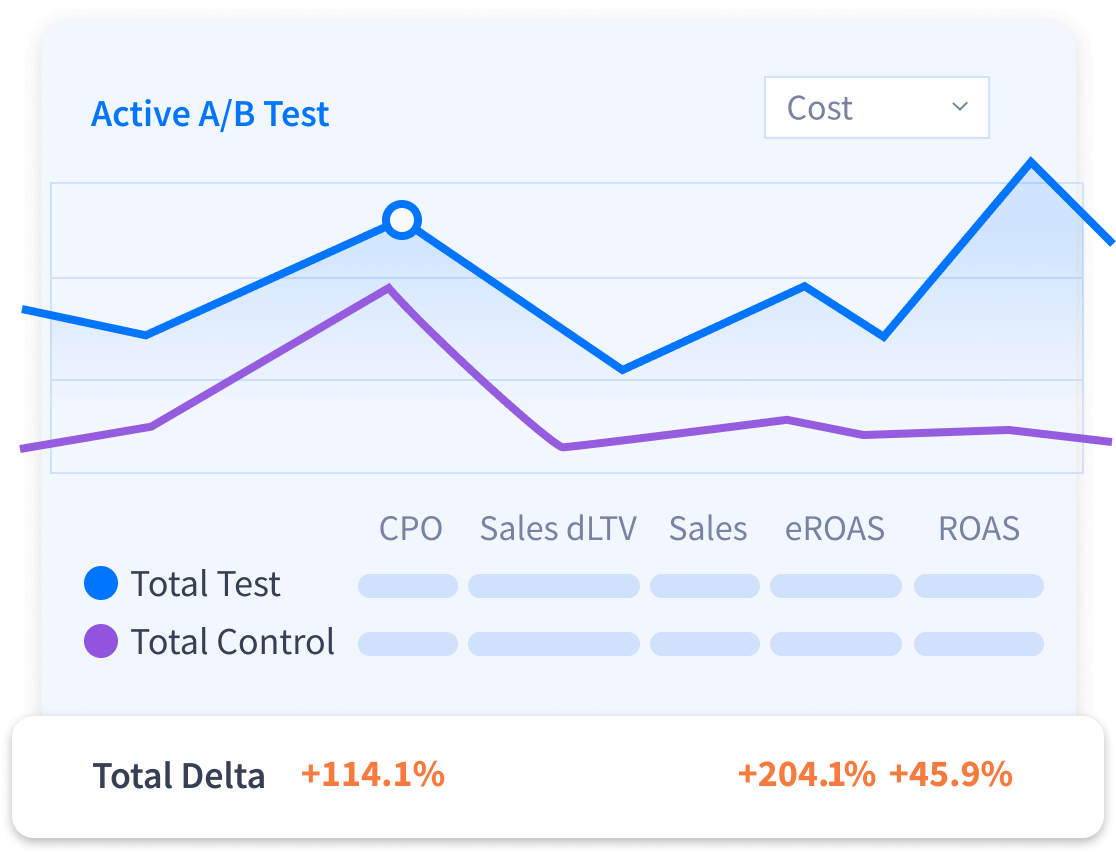
Last-click vs data-driven: proof in both currencies
A statistically significant test on non-brand search for an e-learning company —
Tomi.ai test campaigns vs control, measured under both attribution models.
Highly statistically significant: 87/195 orders in test vs 90/168 in control (last click / data-driven).
Last-click vs data-driven: proof in both currencies
A statistically significant test on non-brand search for an e-learning company — Tomi.ai test campaigns vs control, measured under both attribution models.
Highly statistically significant: 87/195 orders in test vs 90/168 in control (last click / data-driven).
Last-click vs data-driven: proof in both currencies
A statistically significant test on non-brand search for an e-learning company — Tomi.ai test campaigns vs control, measured under both attribution models.
Highly statistically significant: 87/195 orders in test vs 90/168 in control (last click / data-driven).
Advanced A/B testing on top
Find the message that truly resonates
Score the traffic each creative brings — instead of counting clicks — and get statistically significant insights at 10-100x lower cost. Focus on the value of inbound leads and website traffic generated by every message, campaign, and creative.
Why it matters
“Clicks tell you what people notice. Predicted value tells you what they’ll buy.”
Advanced A/B testing on top
Find the message that truly resonates
Score the traffic each creative brings — instead of counting clicks — and get statistically significant insights at 10-100x lower cost. Focus on the value of inbound leads and website traffic generated by every message, campaign, and creative.
Why it matters
“Clicks tell you what people notice. Predicted value tells you what they’ll buy.”
Advanced A/B testing on top
Find the message that truly resonates
Score the traffic each creative brings — instead of counting clicks — and get statistically significant insights at 10-100x lower cost. Focus on the value of inbound leads and website traffic generated by every message, campaign, and creative.
Why it matters
“Clicks tell you what people notice. Predicted value tells you what they’ll buy.”
responsible for 85% of the revenue
responsible for 85% of the revenue
responsible for 85% of the revenue